C:\2000S\GOOGLEMA.TXT
2005
Google Maps: Move the Map, Keep the Page
Google Maps' 2005 browser interface made geography something to manipulate continuously, with tiles that could be reused as the view moved.
A map invites movement. Follow a road toward the edge, and the obvious next action is to move the paper. A browser map that requires a new page for each small movement makes that simple gesture into a series of requests and interruptions.
Google’s February 8, 2005 announcement described a map that could be dragged, with local search results and driving directions. Product manager Bret Taylor presented movement and inspection as ordinary parts of using the page.1
The important change was the continuity of the task. The user could explore an area while keeping the surrounding application available. A map became a surface to manipulate rather than merely a picture returned by a form.
That surface depended on an arrangement of parts. A browser didn’t need to obtain every possible map view in advance, nor did every small movement need to replace everything already visible. Tiling made repeated use of neighboring views a tractable operation.
A view is assembled from pieces
A 2005 patent publication by Jens Rasmussen, Lars Rasmussen and Stephen Ma describes generating, storing and serving map tiles, with browser-side assembly and requests as the view moves.2 It is a technical disclosure, not a complete audit of the February production system.
The useful principle is straightforward. Divide a rendered map into regular pieces. Give each piece an identity. Ask for the pieces covering the current viewport, and place them at the appropriate positions.
Our teaching map is an invented flat plane. It has no geographic projection, roads or real locations. Tiles are 256 pixels square. The viewport is 768 pixels wide and 512 high, exactly three tiles by two when aligned to the grid.
Place its upper-left corner at world pixel (256, 256). Using zero-based tile coordinates, it covers columns 1, 2 and 3, and rows 1 and 2. Six tiles supply the visible rectangle.
Now move the viewport one tile to the right, to (512, 256). It covers columns 2, 3 and 4, still in rows 1 and 2. Four tiles remain useful. Only the two tiles in column 4 are new.
If a cache retains the old six tiles, the next view requires two additional tile payloads in this simplified model. At an invented 20 KiB per tile, that is 40 KiB of additional image data rather than 120 KiB for six entirely new tiles.
These are arithmetic consequences of our grid and cache assumptions. They are not Google transfer measurements, a claim about historical image compression, or evidence of a particular network speed.
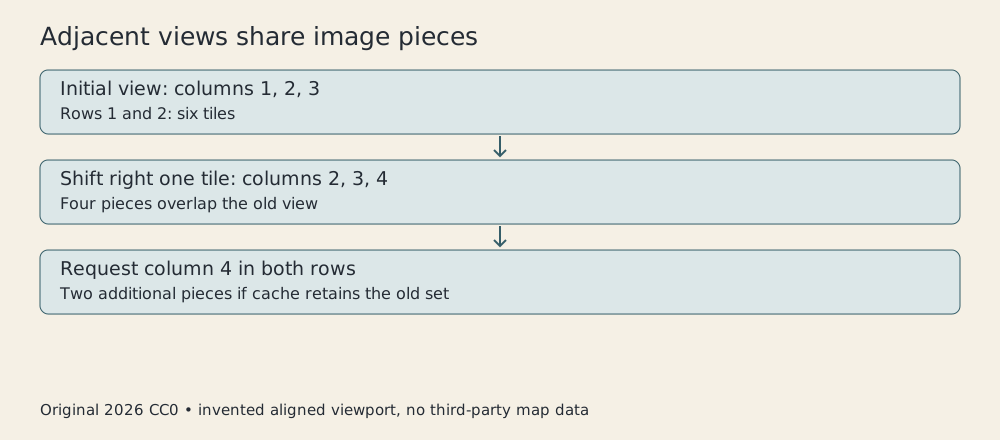
Original CC0 diagram, 2026. Invented pixel plane and viewport; no Google cartographic data or historical screen reconstruction.
The cache matters because adjacent views overlap. If each request discarded all prior pieces, dividing the image alone wouldn’t produce the reuse in our calculation. Identity, retention and placement have to work together.
Moving back to the first position needs no new payload under this model because all six pieces remain cached. A finite cache, expired images or changed map data can produce a different result. “Already seen” and “available without another request” are not permanently equivalent.
The edge cases are literally at the edges
Our first example is conveniently aligned. Move the viewport one pixel farther right, to world x-coordinate 257. It now intersects four tile columns, because a narrow strip of column 4 enters at the right edge.
The same 768-pixel width can therefore need eight tiles rather than six when the vertical position remains aligned. Most of one edge tile may be outside the visible region. Tiles are fetched as units; the viewport clips their displayed portions.
The horizontal rule is:
first column = floor(x / 256)
last column  = floor((x + width - 1) / 256)
The subtraction by one treats pixel positions as a discrete, half-open rectangle: x through x plus width minus one. Without it, a perfectly aligned edge can accidentally include a tile that starts immediately beyond the viewport.
Our Python check enumerates tile coordinates for the original view, the one-tile shift and the one-pixel shift. It confirms six tiles, two newly required tiles, and eight intersected tiles respectively.
No browser is run by that check. It verifies the geometry of an invented tile model. Actual implementations can prefetch neighboring pieces, retain larger margins or request blocks for reasons the model omits.
This is a useful distinction between a minimum covering set and an implementation’s actual requests. Extra requests may be intentional preparation for the next movement. A packet count can’t be interpreted sensibly without knowing what the client was trying to keep ready.
Coordinates hold the layers together
A map display can contain several kinds of information: a background, a marker, a label and a route. They need a common coordinate relationship if moving the view is to keep them aligned.
On our invented plane, place a marker at world pixel (700, 400). In the original viewport beginning at (256, 256), its screen position is (444, 144). After the viewport shifts to (512, 256), it appears at (188, 144).
The marker hasn’t moved in the world. Its screen position changed because the viewer’s origin changed. Subtracting the viewport origin is enough for this flat model.
A real geographic map needs a transformation from geographic coordinates to a projected display and a scale appropriate to the zoom level. Our subtraction example deliberately begins after that work. It doesn’t assert that longitude and latitude can be treated as screen pixels.
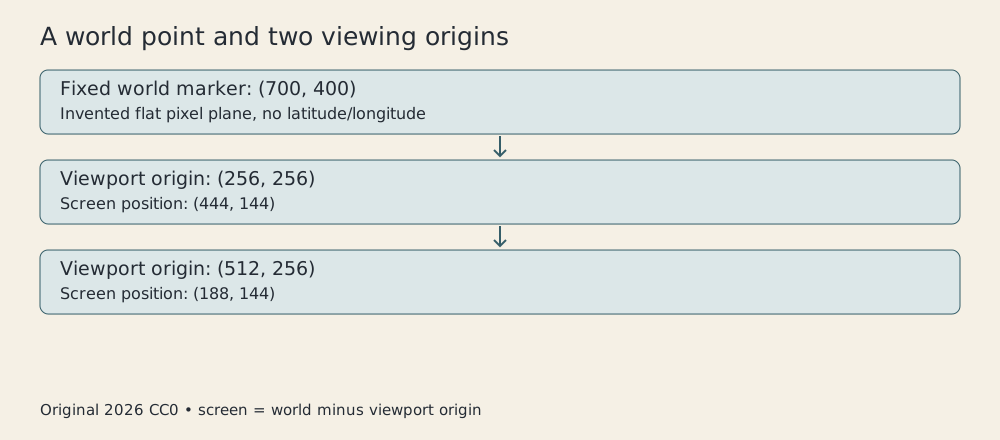
Original CC0 illustration, 2026. Flat-plane subtraction example, not a geographic projection or actual Google marker.
This separation helps explain why overlays can remain useful during navigation. A marker belongs to a world location, and the application recalculates where to draw it in the current view. Storing only its old screen position would leave it attached to the window instead of the place.
It also reveals a source of plausible errors. A marker can be drawn beautifully at the wrong location if an upstream address was interpreted incorrectly. Rendering and geocoding solve different problems. A smooth map doesn’t certify that a search result refers to the intended building.
Zoom changes the useful picture
Zooming is more than making each existing pixel larger. A map at another scale may need different detail, labels and image pieces. Magnifying a low-detail picture can’t recover information that isn’t there.
A tile identity can therefore include a scale level as well as horizontal and vertical position. A piece at one level isn’t interchangeable with the piece bearing similar coordinates at another. The patent disclosure describes tiles and zoom levels within its proposed generation system.2
In our model, a key is the tuple (level, column, row). Changing only level produces different cache keys. The old pieces might be temporarily useful as a visual approximation, but they don’t become the new detailed map simply because they are enlarged.
This is why the map can look settled while still waiting for sharper information. The application has several responsibilities: respond to the gesture, arrange what it already has, and replace or supplement that arrangement when suitable data arrives.
Responsiveness isn’t identical to completeness. A user can receive immediate visual feedback while parts of the requested view remain unavailable. Designing that intermediate state clearly is part of making a networked application feel coherent.
Three milestones belong to three dates
The satellite view was a later addition within 2005. On April 4, Keyhole general manager John Hanke announced imagery integrated into Google Maps and Google Local.3 It shouldn’t be inserted into the February launch simply because it became a familiar mode afterward.
Images and road maps answer different questions. A road map emphasizes selected connections and names. Imagery can show other visible features, but its capture date and interpretation matter. Neither view is a live guarantee that the world hasn’t changed.
Then, on June 29, Google’s developer announcement made an API available for interactive maps on other websites.4 The map could become a component inside another application rather than requiring every task to begin at Google’s own page.
Imagine a library website with a list of branches. Attaching each branch’s record to a location lets visitors inspect the relationship between the list and the area. The library supplies branch data; the mapping component supplies a shared geographic display.
That division doesn’t make the library’s information automatically accurate. A moved branch, malformed coordinate or outdated opening time remains the responsibility of the relevant data source. Combining services combines their obligations as well as their capabilities.
No current API is called for this article. Today’s authentication, pricing and JavaScript interfaces aren’t instructions for the 2005 product. The historical claim is the dated availability of the embedding interface, not the permanence of any present commercial arrangement.
Geography becomes an application surface
Google Maps didn’t invent maps or all forms of online mapping. Its 2005 milestone made continuous inspection in an ordinary browser a persuasive everyday interaction. Directions, nearby results and movement belonged to one working surface.
The tile example shows one reason that experience was practical. Neighboring views shared pieces. Identifiable pieces could be retained. A moving origin let overlays remain tied to their locations. Different levels could provide detail suited to different scales.
There were still difficult problems behind the surface: geographic data, labels, routing, search and service operation. The tile calculation isolates one mechanism rather than pretending to explain the entire product.
That mechanism changed the cost of the next small gesture. Following a road toward the edge could become another movement within the task, rather than an occasion to reconstruct the whole page. A map is most useful when the person using it can keep thinking about the place.
Sources
Footnotes
-
Bret Taylor, Google, Mapping your way, February 8, 2005. Launch announcement, dragging, local results and directions. ↩
-
Jens Rasmussen, Lars Rasmussen and Stephen Ma, Generating and serving tiles in a digital mapping system, US20050270299A1, published December 8, 2005. Selected technical disclosure read; a patent embodiment isn’t proof of every deployed implementation. ↩ ↩2
-
John Hanke, A bird’s-eye view, April 4, 2005. Keyhole imagery addition, distinct from February launch. ↩
-
Google, Google Releases Maps API for External Use, June 29, 2005. Dated API announcement; current API behavior excluded. ↩